Optimize performance with Blackfire Profiler on Platform.sh. Monitor server resources, identify bottlenecks, and compare codebases for better performance.
This post was originally published on the Platform.sh blog and reflects information from the time of publication.
Today, we are very happy to announce that the PHP containers deployed on Platform.sh come pre-installed with the Blackfire Profiler developed by SensioLabs.The Blackfire Profiler monitors your Platform.sh code and reports on consumed server resources like memory, CPU time, and I/O. With the Blackfire Profiler on Platform.sh, you can quickly identify performance bottlenecks in code, and even compare two different codebases directly to see which performs better. Best of all, the Blackfire Profiler is currently totally #, and easy to set up.
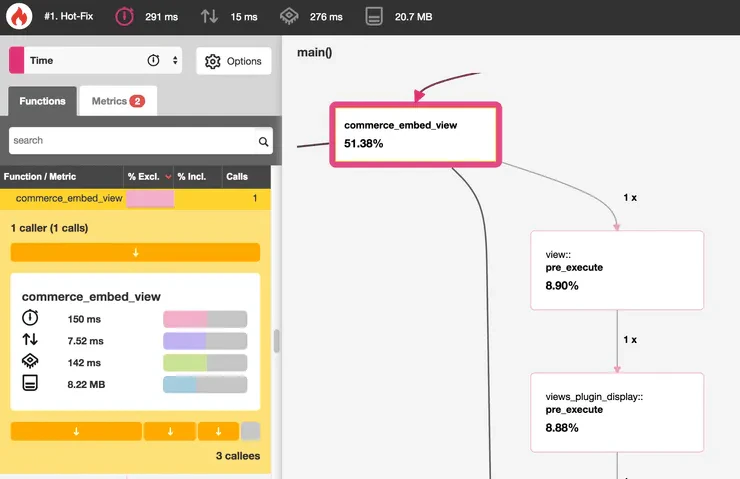
Blackfire Profiler automatically instruments your code to gather data about consumed server resources like memory, CPU time, and I/O.You can launch profiling from a web-browser widget or through a CLI utility to keep track of the results online, where it will be easy to select two profiles and compare them.Even with a low overhead, Blackfire profiler will go deep into the details and show you information about your entire stack; including, for instance, SQL database engines or cache servers.Call graphs are displayed in a lovely UI where it’s easy to focus in on the relevant data by quickly finding the hotpath, and not displaying “noisy” function calls.Still in beta but already adopted by thousands of developers worldwide, Blackfire is provided as a free SaaS service. Paid tiers with additional features are planned for later this year.Those who have tried it seem to love it. Check it out for yourself !
Blackfire Profiler is already installed in your PHP container, which means that the only step for you to use Blackfire is to configure the environment and install the web browser Companion.Read more on configuring the Blackfire Profiler on the Platform.sh documentation.
Last modified on April 20, 2026
Was this page helpful?
Assistant
Responses are generated using AI and may contain mistakes.


 Dispatch
 Cloud
Cloud