- App containers: one or more app containers
- Service containers: zero or more service containers
- Worker containers: zero or more worker instances.
Example of how to read metrics
This example should give you an idea of how the metrics appear. Environment metrics show resource usage for each app, service, and worker container. This reference project has a single app, two services (MySQL and Redis), and two workers. The appropriate resources have been manually allocated for each container. The graphs show the current average usage in relation to the resources allocated to each container. By default, the graphs include all instances and an average over the instances. To select metrics for specific instances, click Filter.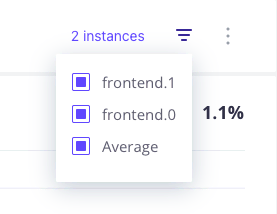
App container
Metrics graphs for the app container show CPU, RAM, and disk allocation and usage. The persistent disk has been configured in the project resources.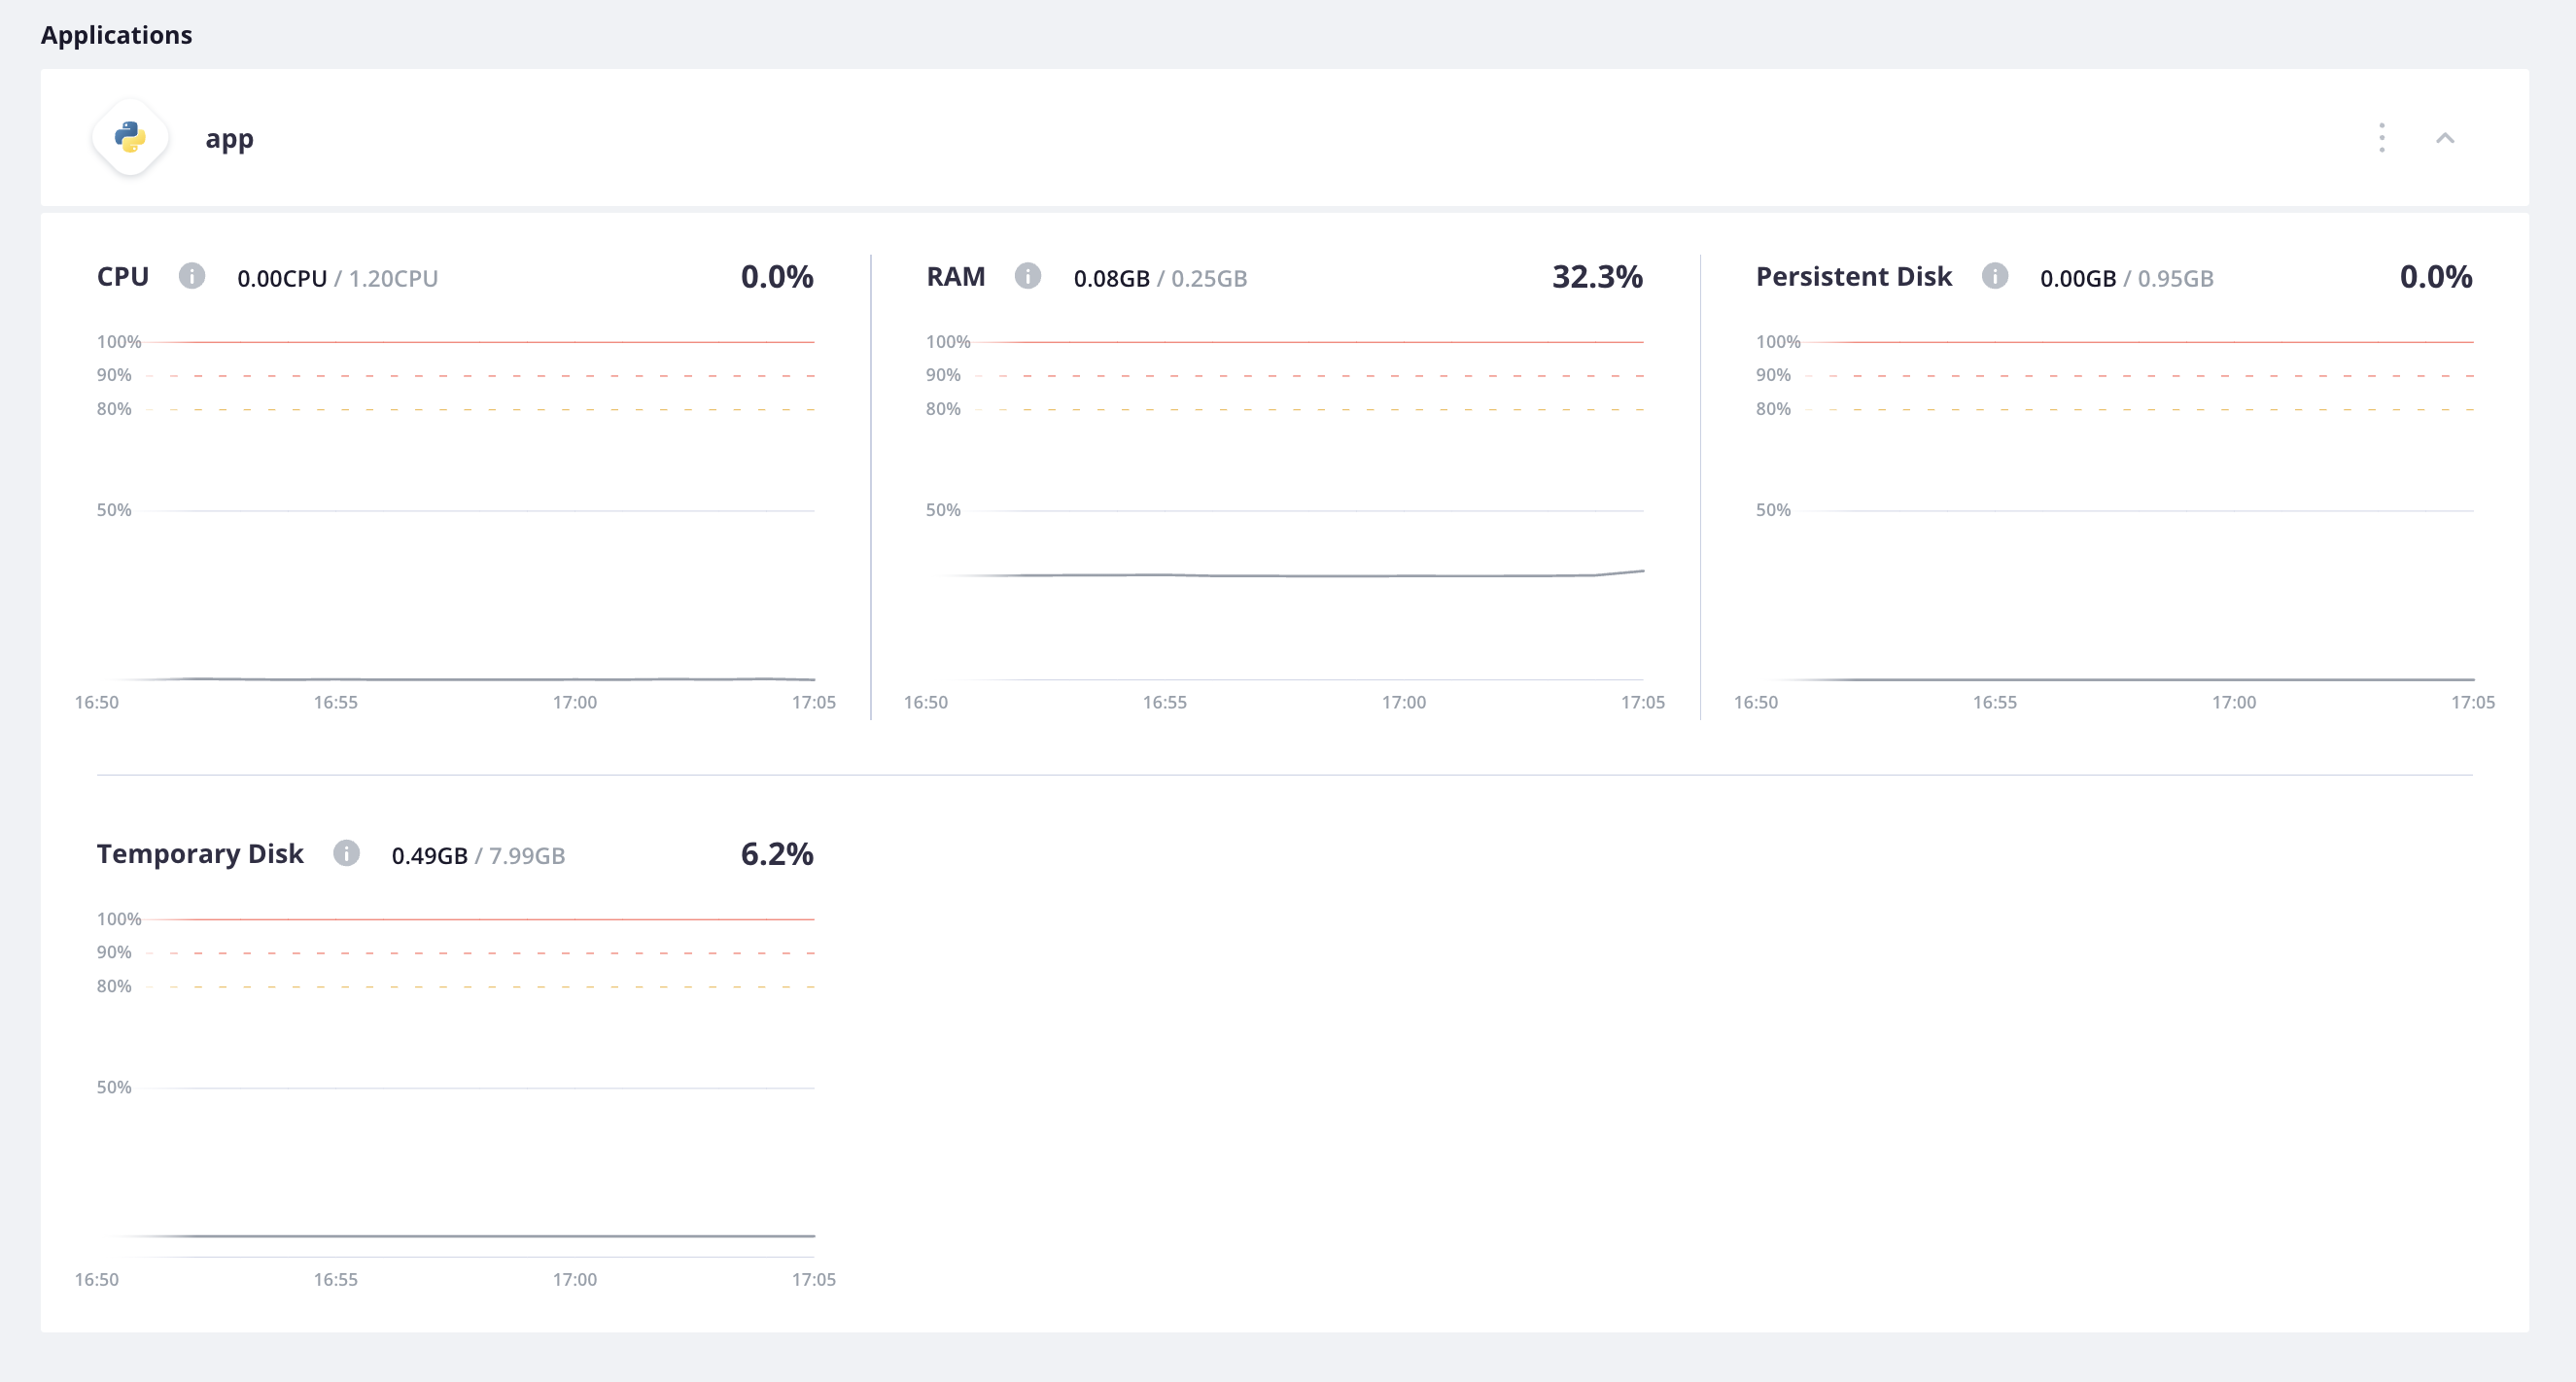
Service containers
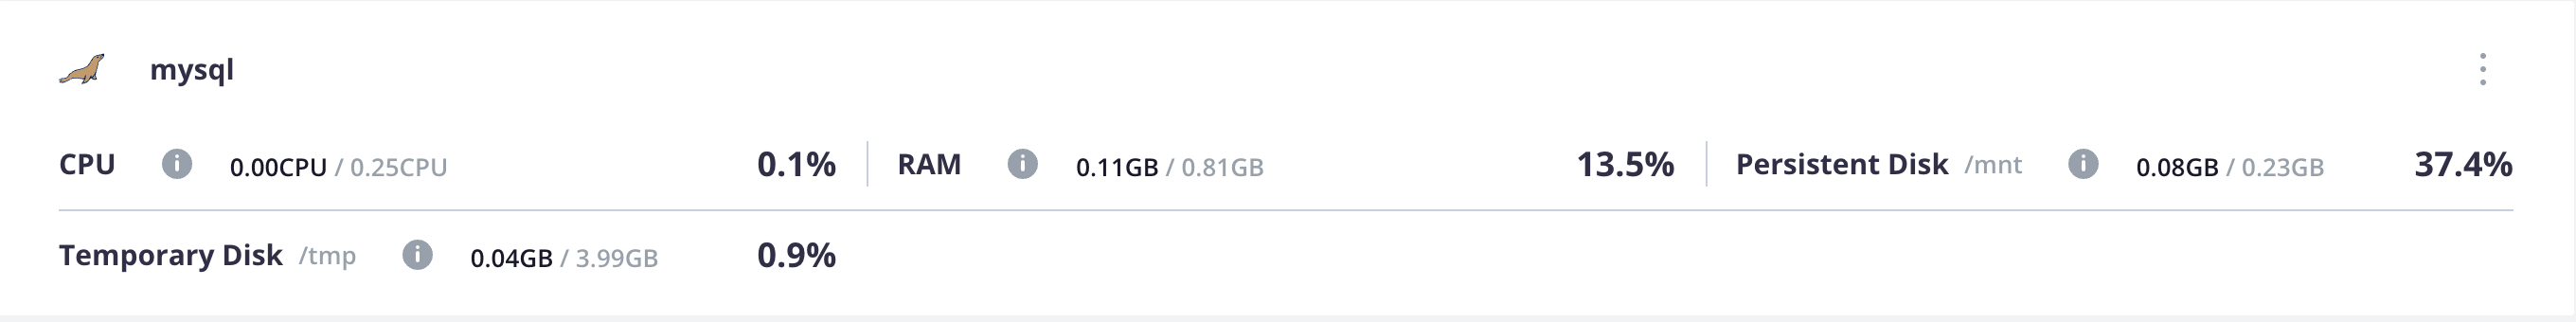
Metrics graphs for the service containers show CPU, RAM, and disk allocation and usage.MySQL
Metrics graphs for the MySQL service container show CPU, RAM, and disk allocation and usage. The persistent disk has been configured in the project resources.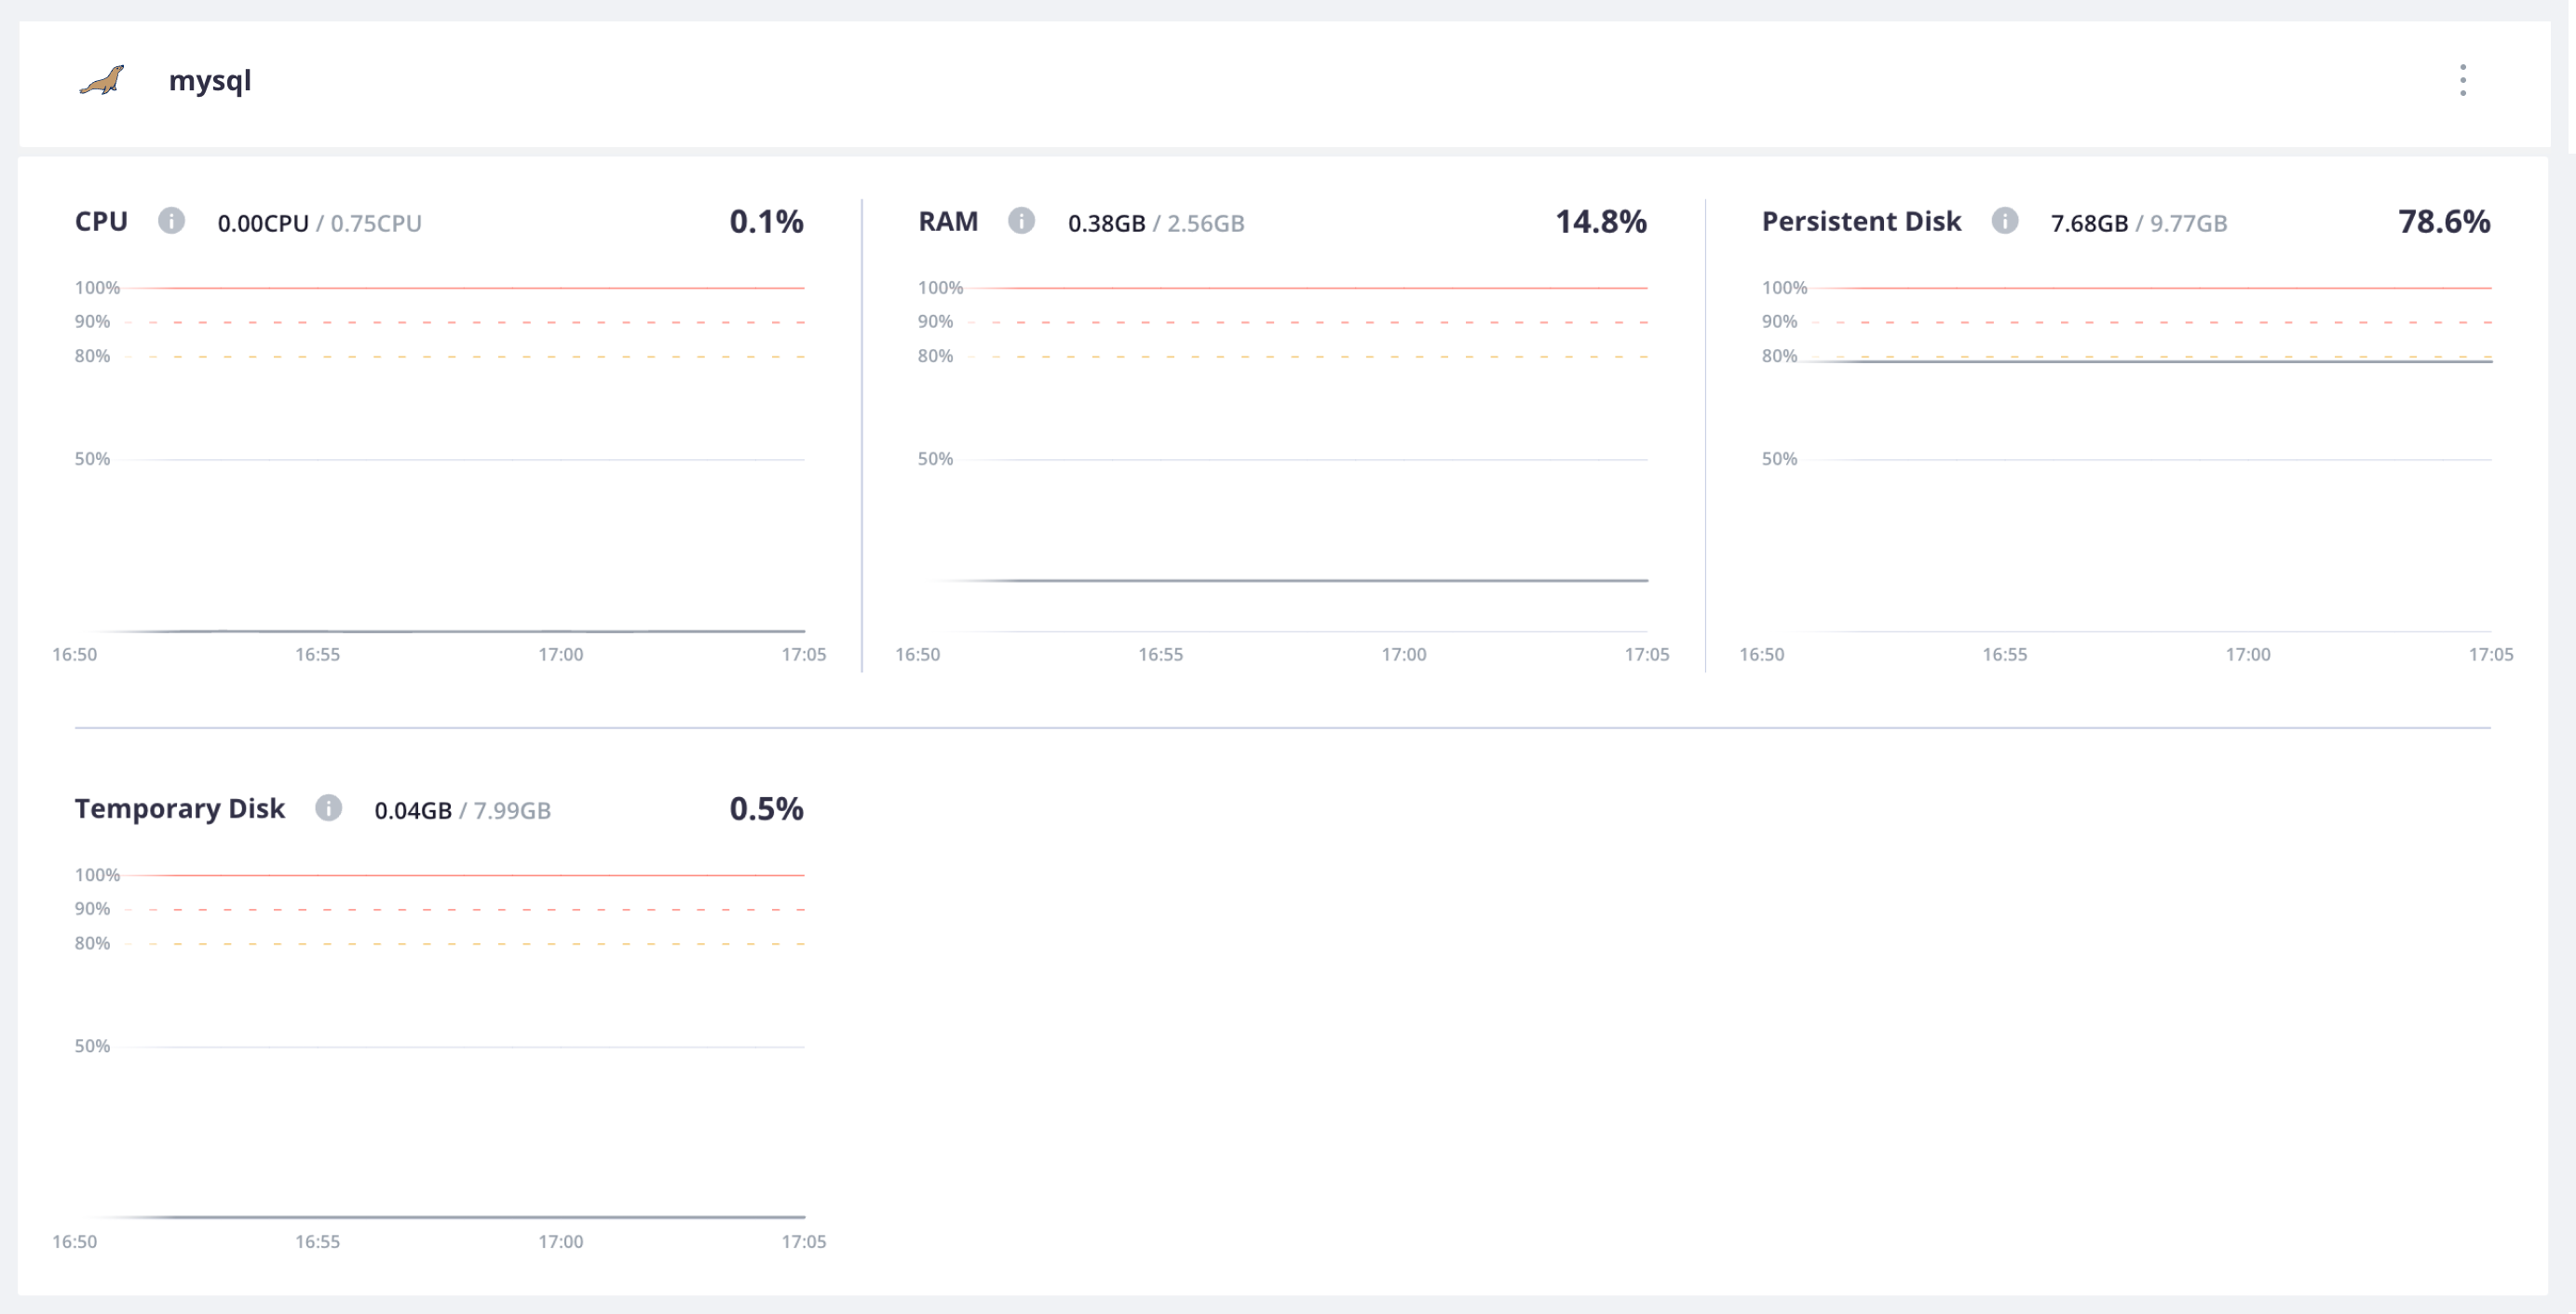
Redis
Metrics graphs for the Redis service container show CPU, RAM, disk allocation and usage. No persistent disk has been configured for Redis.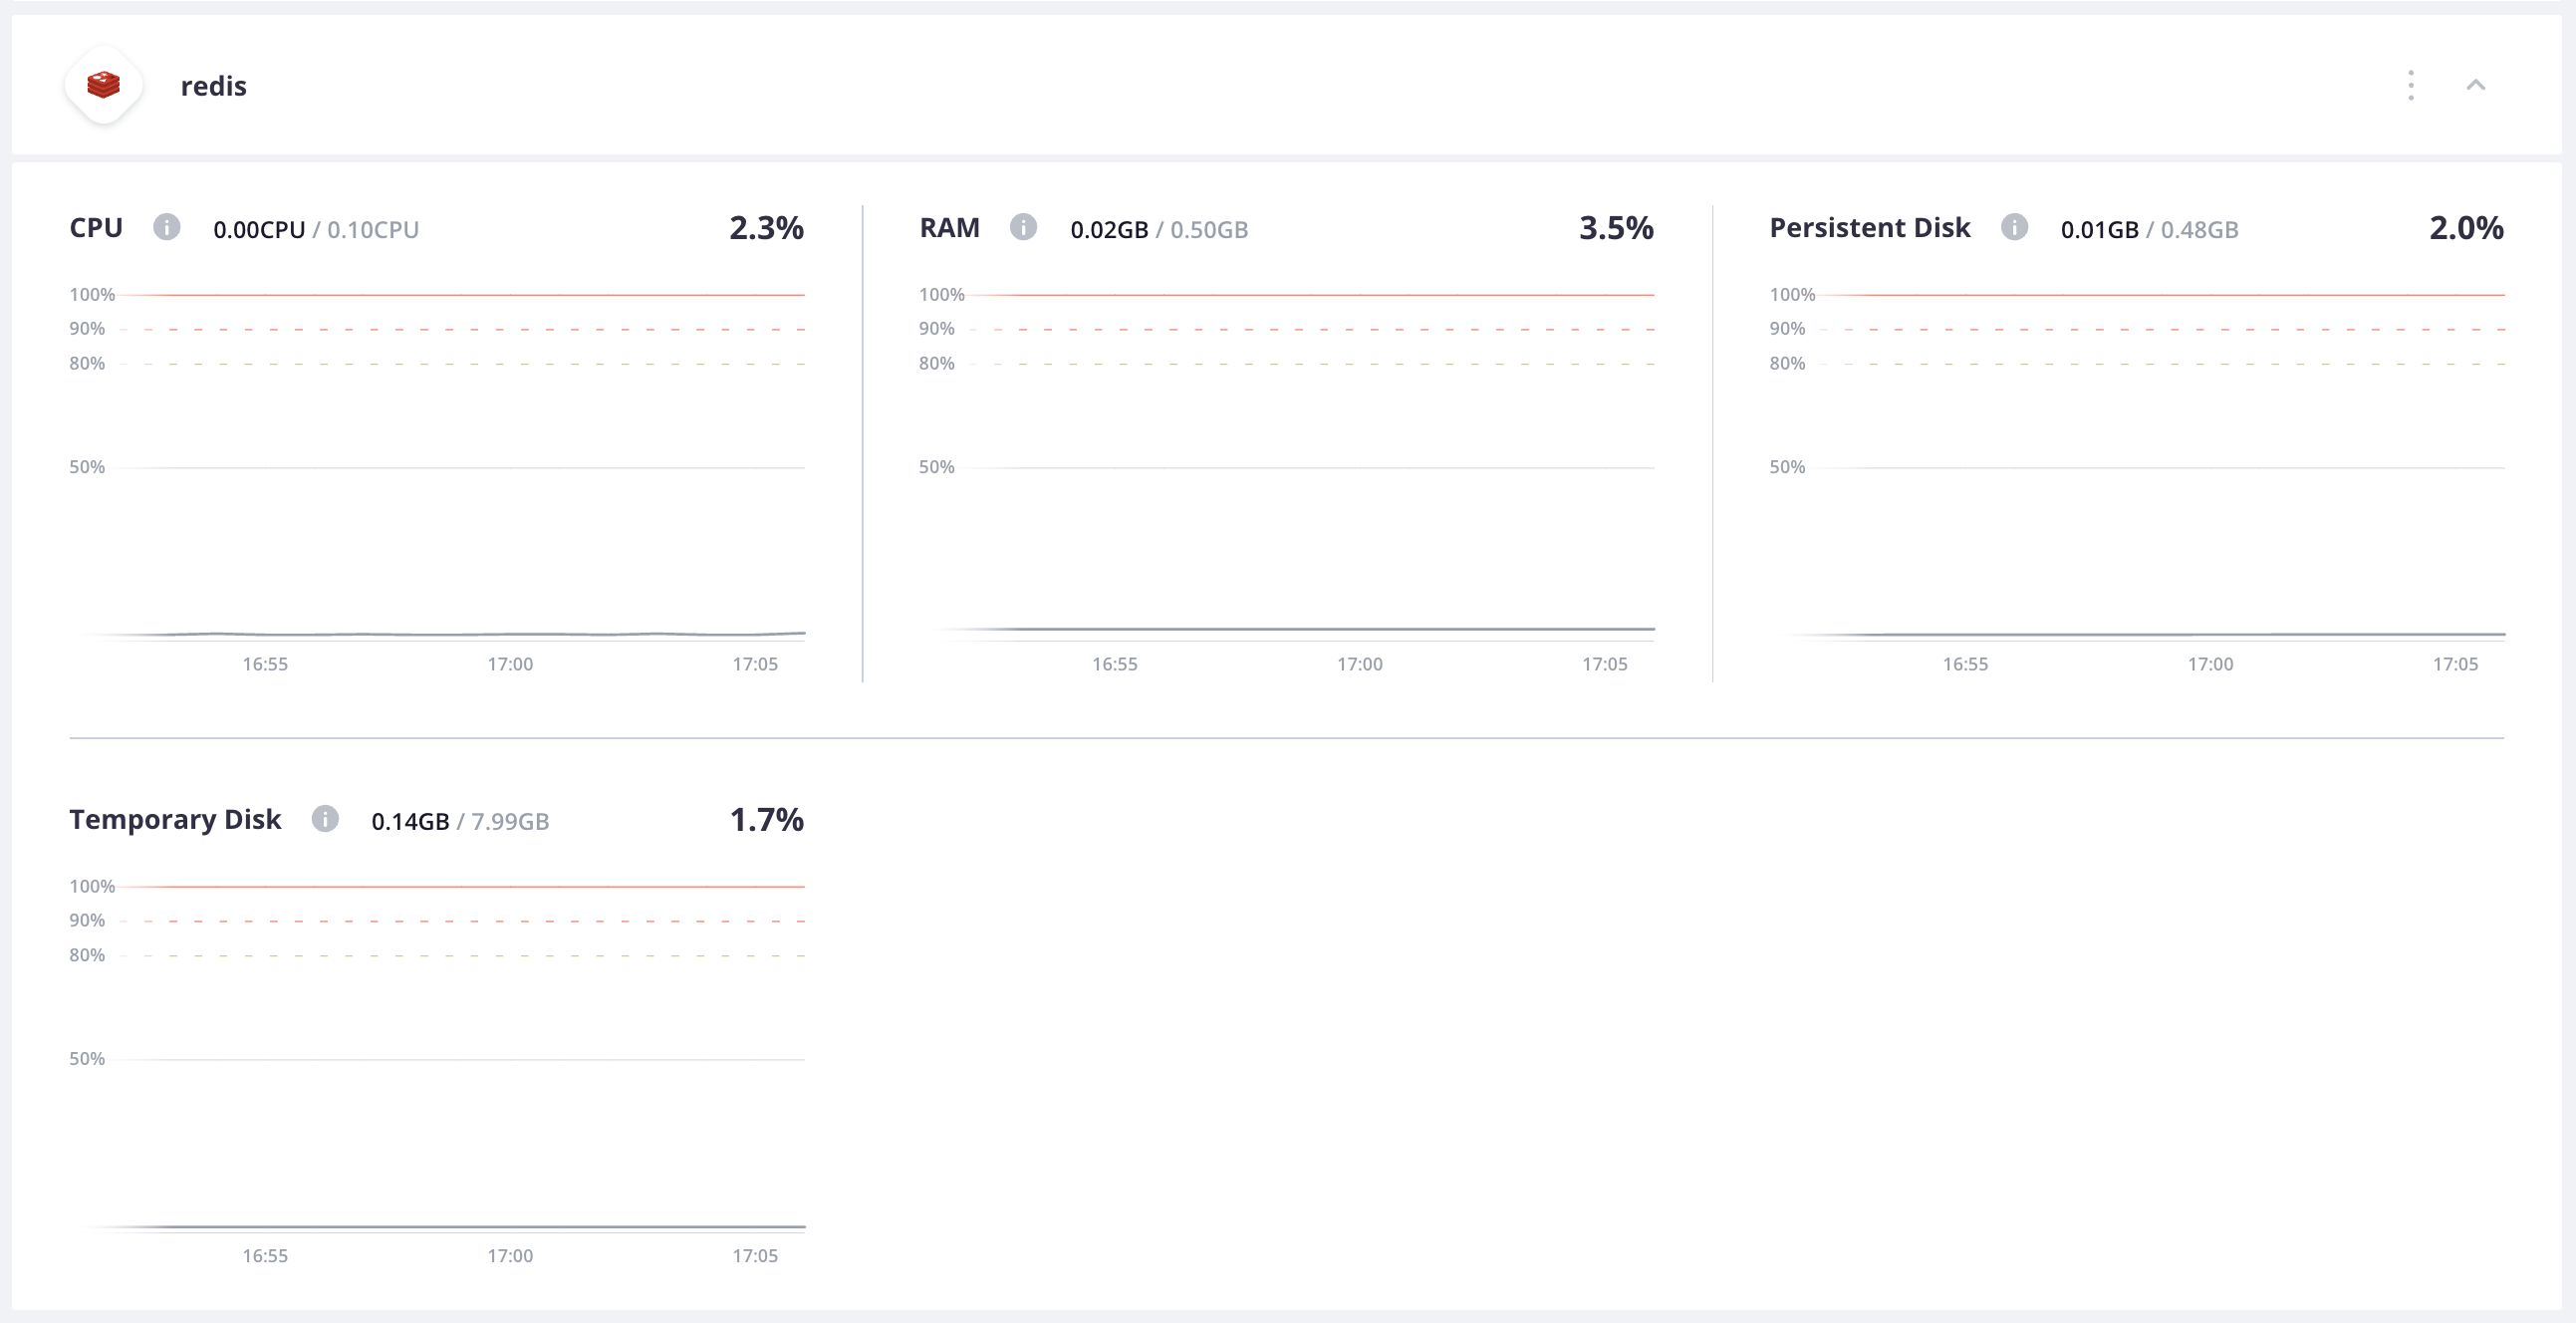
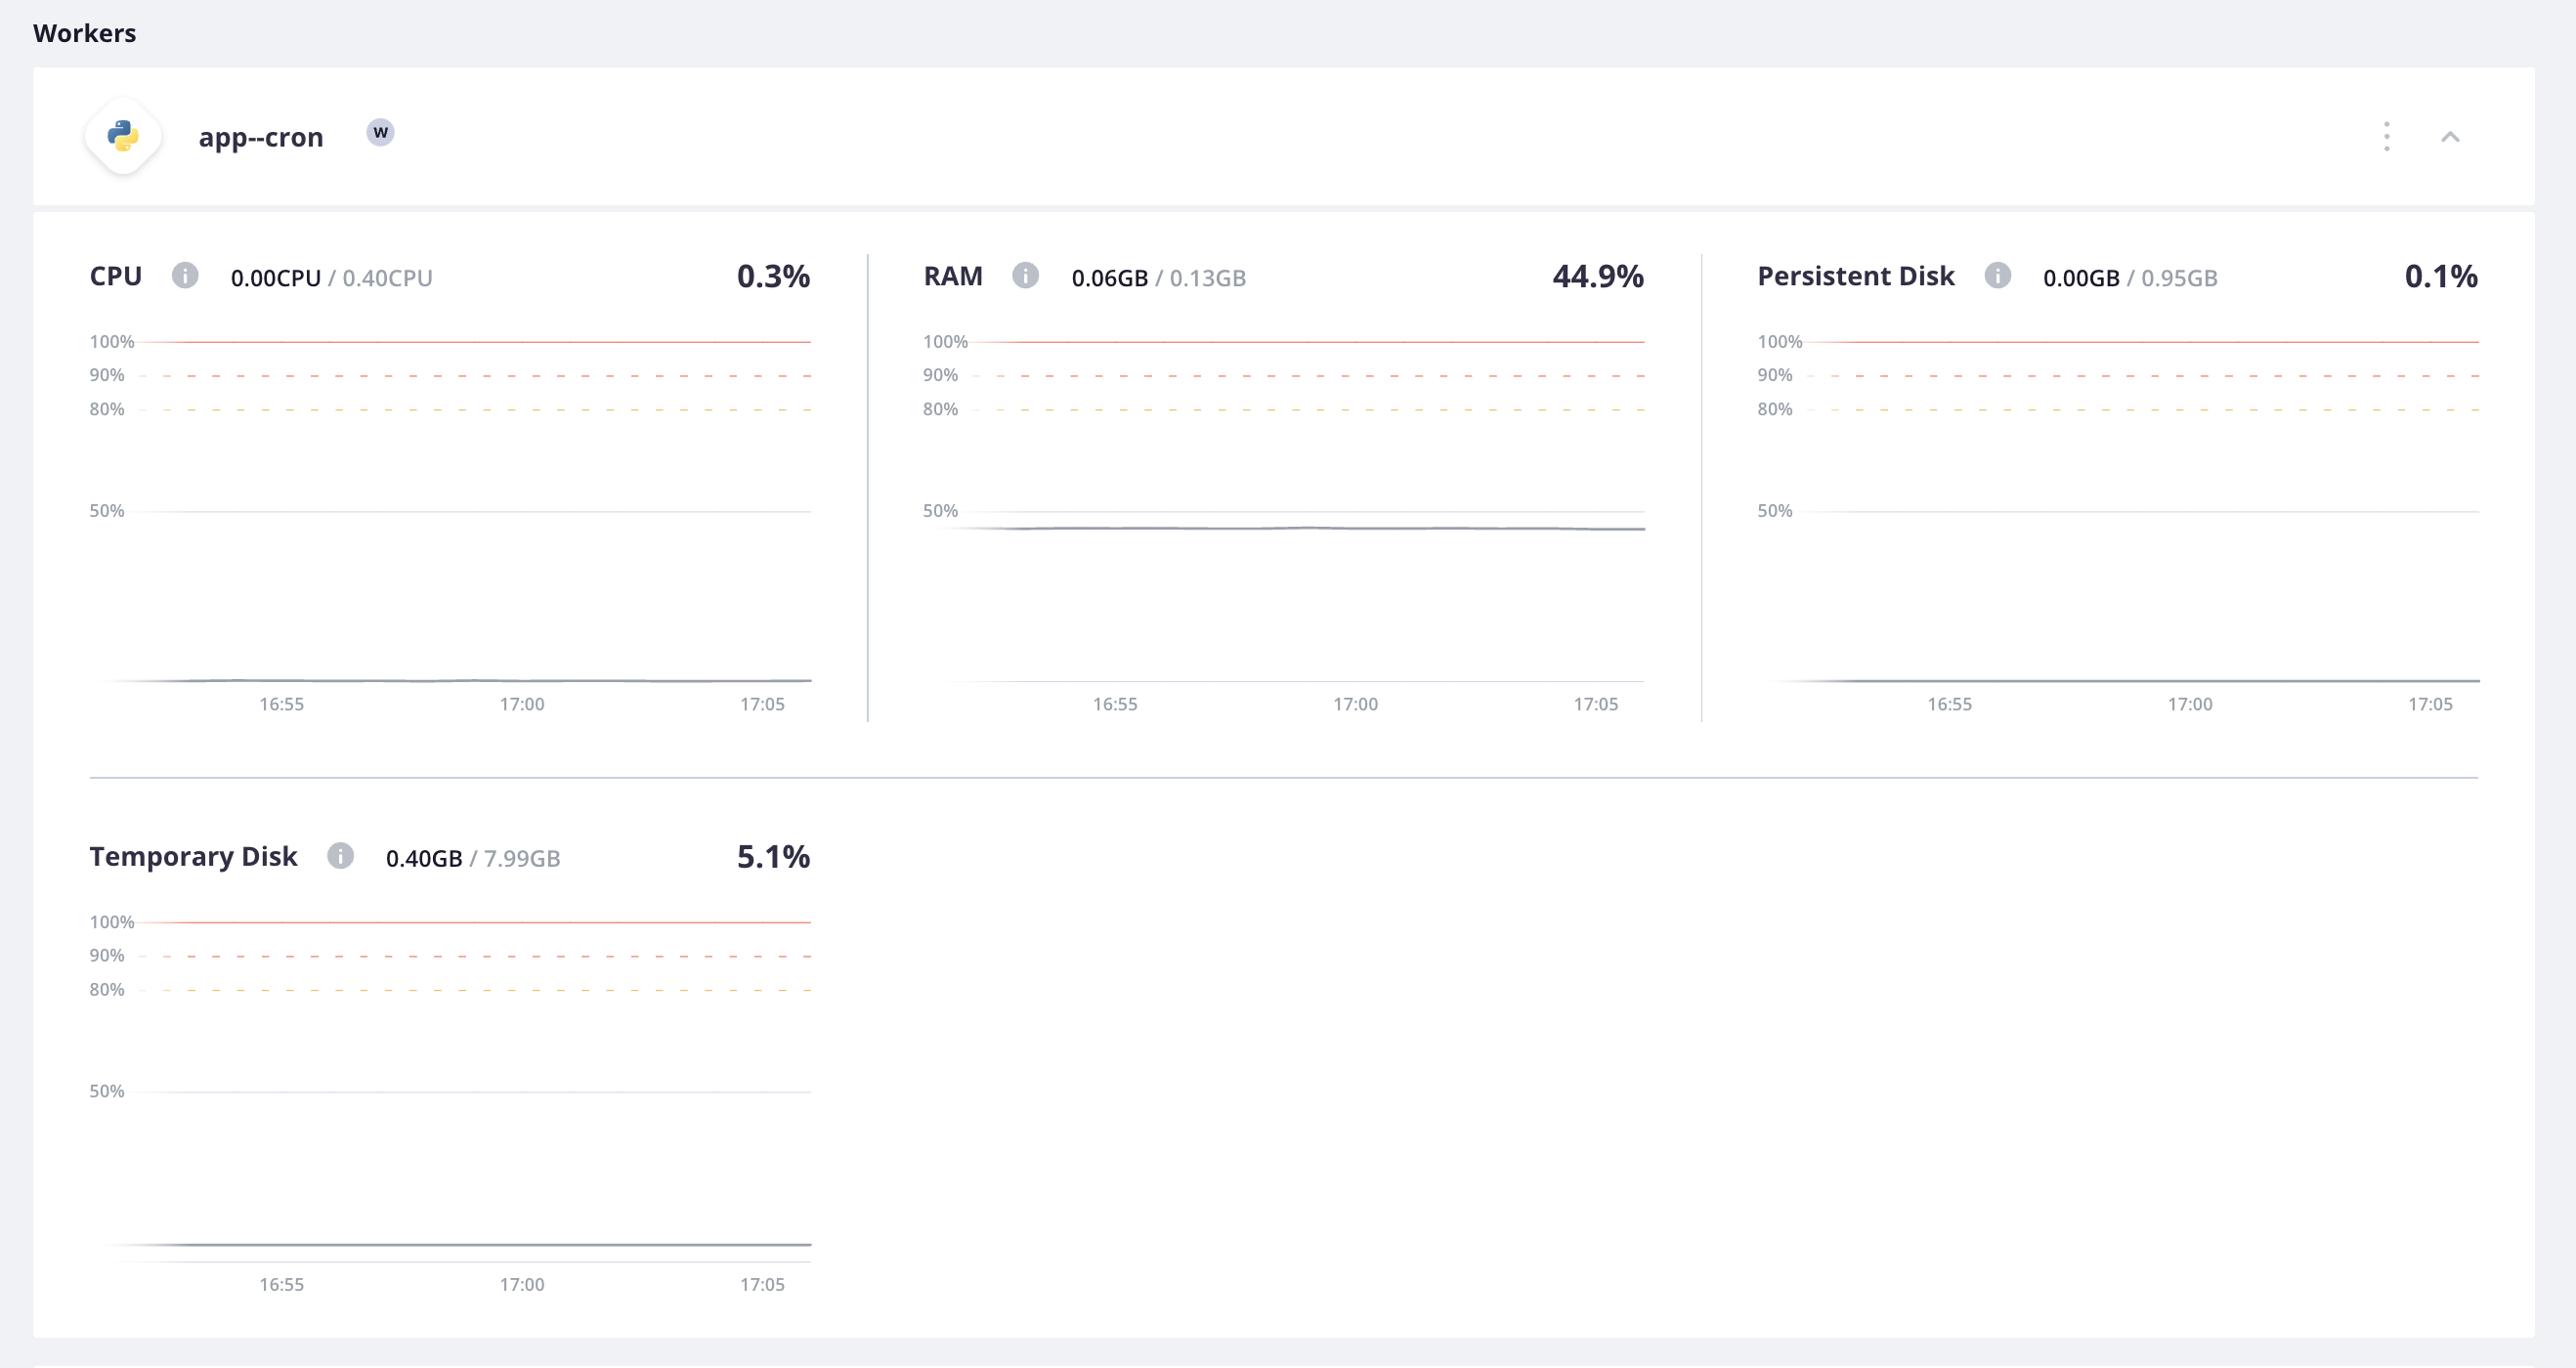
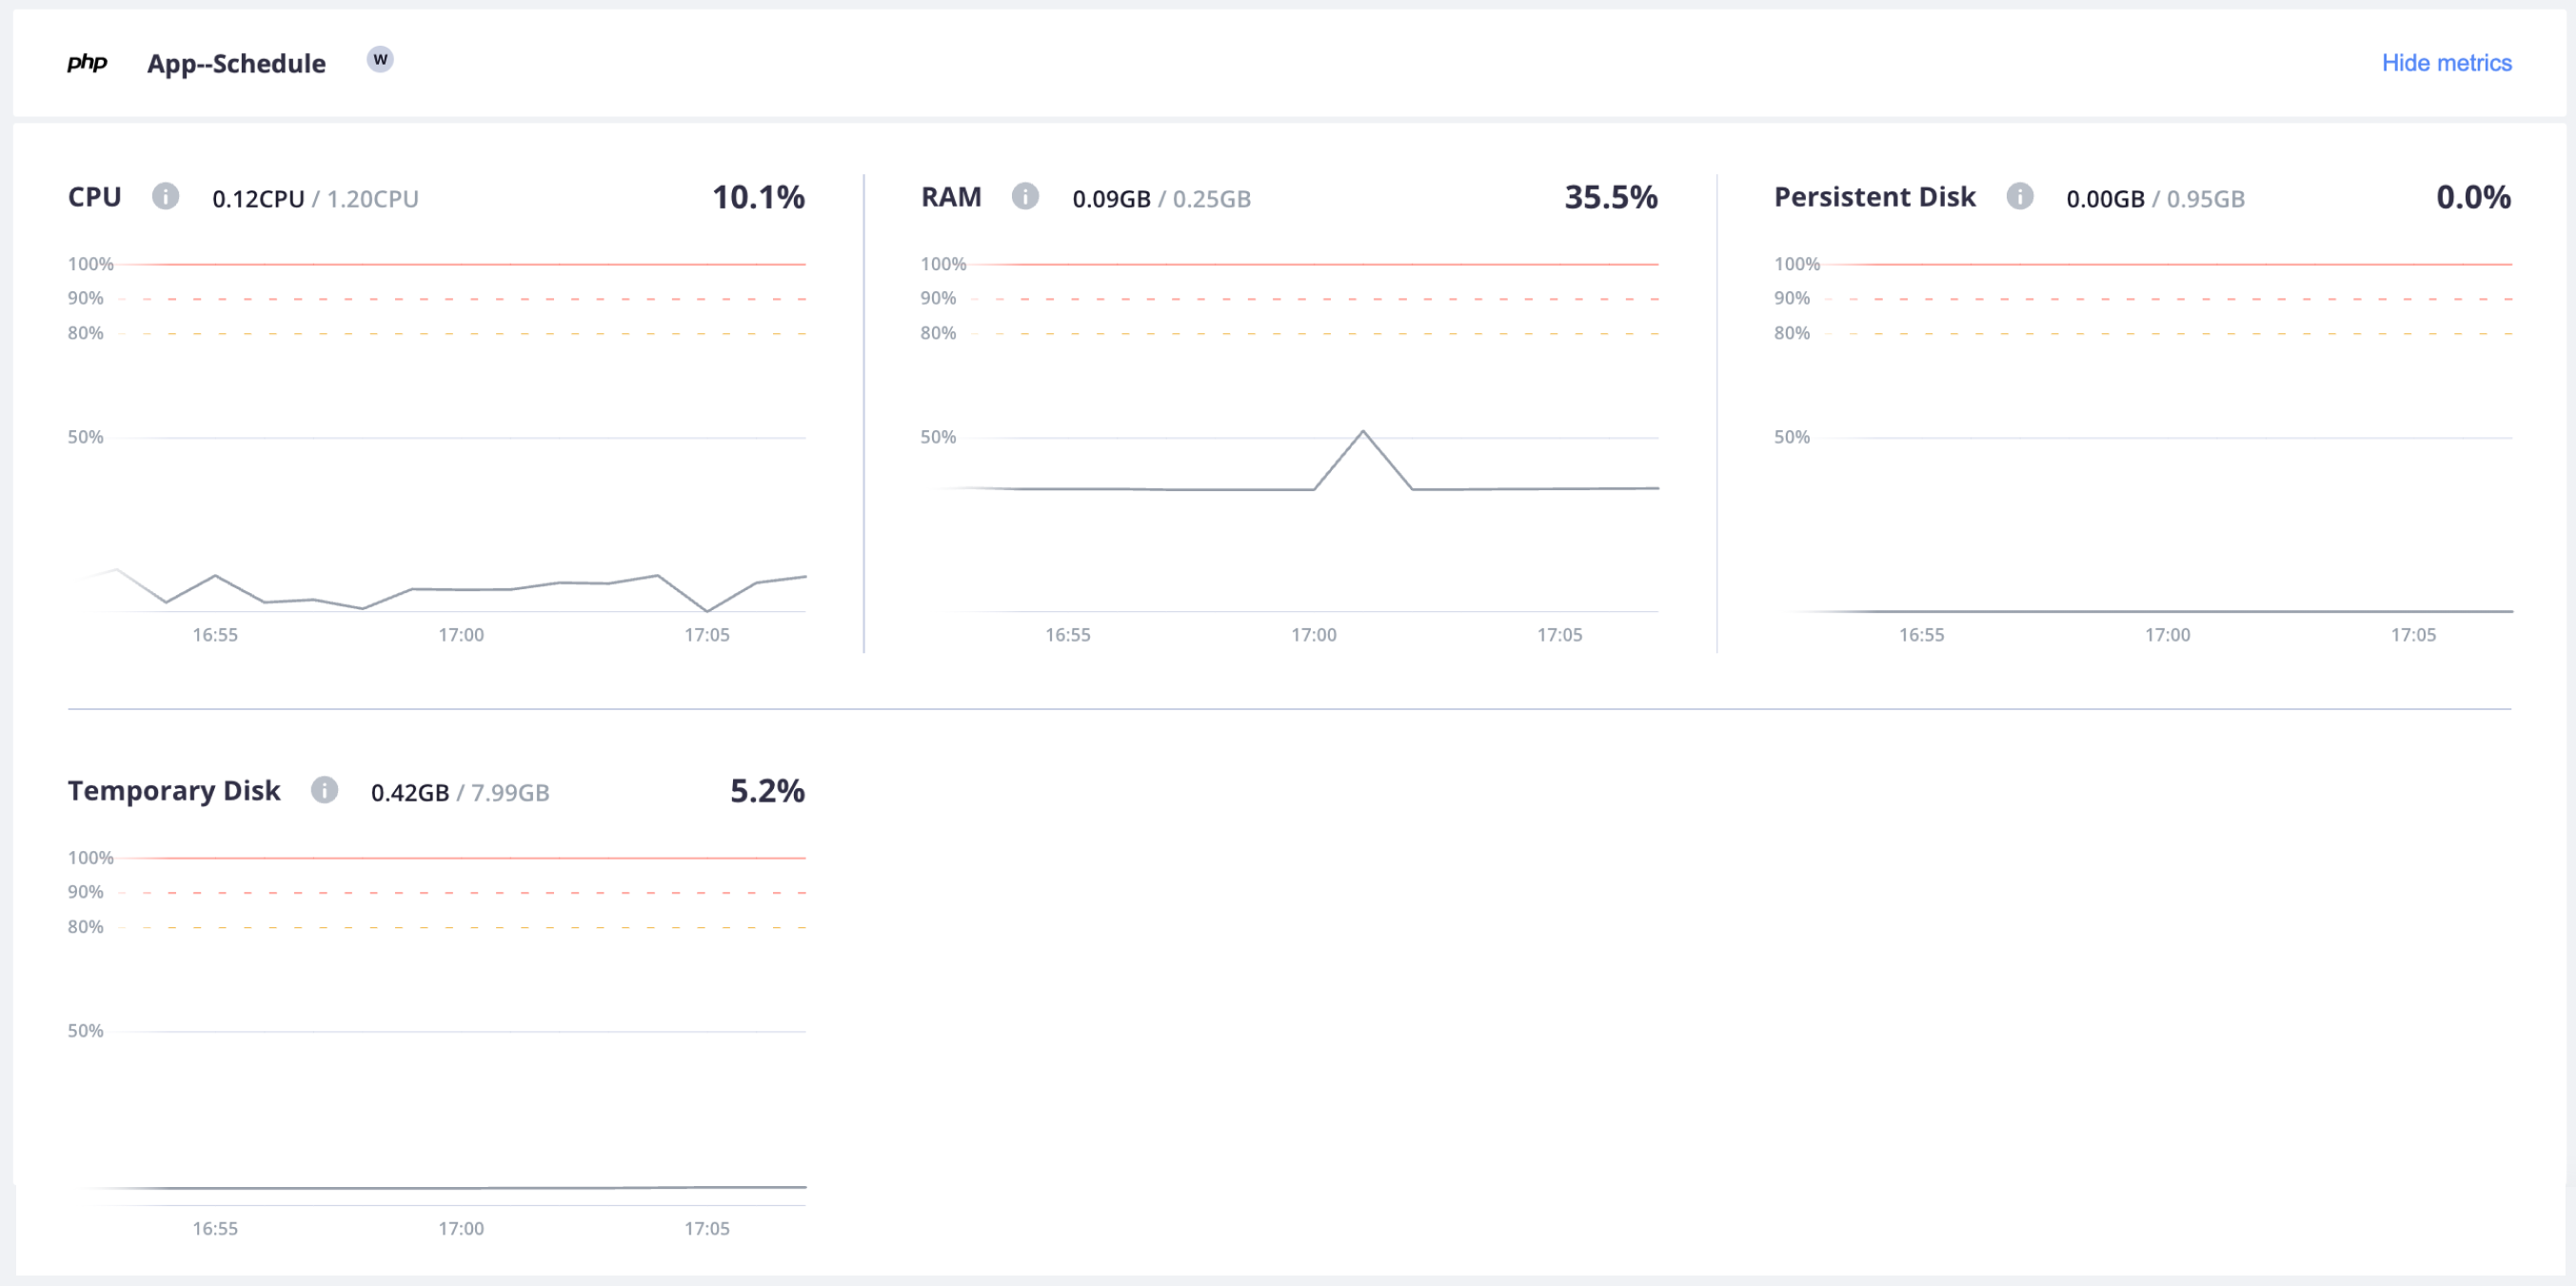
Worker containers
Metrics graphs for the App-Horizon worker container show CPU, RAM, and disk allocation and usage. The persistent disk has been configured in the project resources.