This post follows on from the introduction to the Upsun API
This is an example intended to illustrate how it’s possible to leverage the API to manage your projects and horizontaly scale your application on demand.
If you have any feedback to make or require assistance feel free to open an issue on the related github repositories or to contact the Activation team at the following address: activation@platform.sh.
Requirements:
- A working, running Upsun project, and access to its code.
- An API key you can publish to the project. This token provides permissions to change your project properties.
- A script or utility that checks the project status and reacts to high or low stress conditions by upscaling or down-scaling as appropriate.
scalsun README and should be easy to follow. To summarize:
- Install the utility at build time.
- Add a cron job to periodically run the tool.
- Add your token to the project environment.
About upscaling
Since it is horizontal scaling, there is no rebuild triggered. See Horizontal scaling on Upsun. Additional instances of the app container are added, and inserted into the routing rules. This means that capacity can be increased or decreased in real time without interruption. This only applies to the application behind the web server - not the data services. Database, cache or search services are not suitable for horizontal scaling like this, as data replication is a much deeper challenge, and needs to be engineered for.Behaviour under load
Here is a graph of a load test simulating a surge of activity over time. The load test was done using thek6 tool,
and a scenario of roughly bell-shaped traffic,
building to a peak of 200 requests per second.
HTTP traffic during an artificial load test
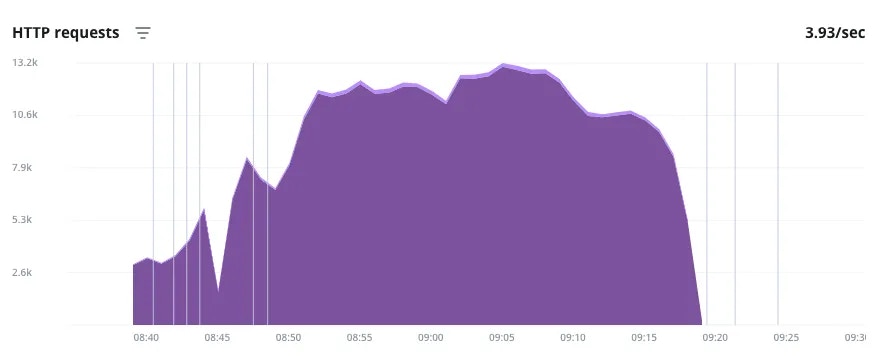
- The vertical lines indicate events where infrastructure changes were made (more info can be seen on mouseover on the real thing). In this case, each of the lines at the beginning of the surge denote the upscaler being triggered and adding an application instance.
- The same is seen at the end, and it depicts how the cool down in traffic takes some extra lag time before the additional instances are scaled down.
- The valley and the roughness in the graph is just an anomaly, possibly because the URL requests were being randomized and producing uneven load results.
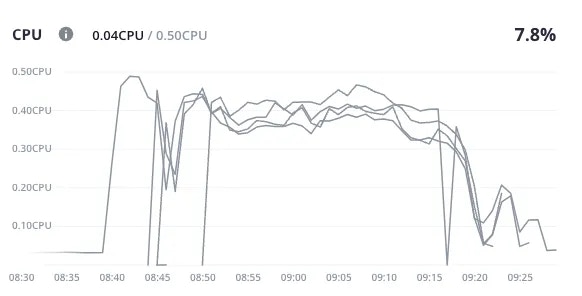
- Here we see the CPU load increasing as the HTTP requests went up.
- This is followed by additional instances of the application - indicated here as new lines - being brought online one after the other.
- Each spike is followed by a dip as a new instance succeeds in bringing the load average down.
- The reverse is seen as the traffic eases off - each time the average CPU load goes down enough for an instance to be removed from the pool, the average spikes again for a bit as the remaining instances take up the load.
About the parameters
The parameters are documented in the README, so start there for the most up-to-date options.-
nameIf nonameis defined, then all apps and services are polled. This might not be what you want, as some apps or services (like Redis cache) are designed to operate at capacity and self-regulate, and may trigger upsizes inappropriately. It’s best to explicitly name the app that you wish to monitor. -
max_host_countThis is the maximum number of instances of the application that will be deployed when needed. There is a regional hard upper limit as well, as the horizontal scaling will be distributed over different locations where possible. -
min_cpu_usage_upscale,max_cpu_usage_downscale,min_mem_usage_upscale,max_mem_usage_downscaleThe upscale/downscale usage parameters are compared against an average of the last 5 minutes (or duration as defined). As described, these are thresholds that determine when the upscale or downscale action is triggered. The buffer between the two thresholds is to prevent too much ‘flapping’ - it will add an extra application instance when CPU usage is averaging above 75% for 5 minutes, but only remove that instance when the total usage of the active instances is averaging below 60% for 5 minutes. Both CPU and memory usage are polled and either going over themax_value may trigger an upscale. A downscale should only happen when both metrics are below the safe threshold.
Under the hood
As discussed in using the upsun-api, thescalsun utility makes these changes by leveraging the tools that you already have access to.
Looking at the activity logs that record a successful upscale event,
you may see what is actually happening.
upsun metrics:all command to check the current status, but it will not take into account (at the moment there is a boolean set to false by default to exclude service) the services metrics
and the upsun resources: commands to request infrastructure changes in response to your own rules or heuristics.
Hopefully you can imagine how you may extend this to enhance it with your own logic if you have more interesting use-cases!
Looking forward
This demonstration is not a fully featured enterprise level autoscaling solution, it is a demonstration of what abilities and features you could use to automate your own resource management in response to demand. Following are a few suggestions of ways this could be extended…This demonstration uses cron
For convenience, this demonstration of the scalsun tool works by running as a cron job every 5 minutes.
This is just easier to set up, and doesn’t invoke any extra new concepts or services.
Running cron so frequently could be sub-optimal for a number of reasons.
- The
cronactivity may fill up the logs really fast and make it harder to spot real issues. cronintervals are limited by default to 5 minutes for normal accounts on the Upsun servers.- On the other hand, for some business cases, every 5 minutes may not be enough. Standard Upsun accounts cannot run a cron more frequently than that (though this can be arranged for Enterprise plans if needed).