> ## Documentation Index
> Fetch the complete documentation index at: https://developer.upsun.com/llms.txt
> Use this file to discover all available pages before exploring further.
# Access your logs
> Increase your knowledge of how your apps are performing by accessing their container and activity logs.
export const ShareIcon = () => ;
## Activity logs
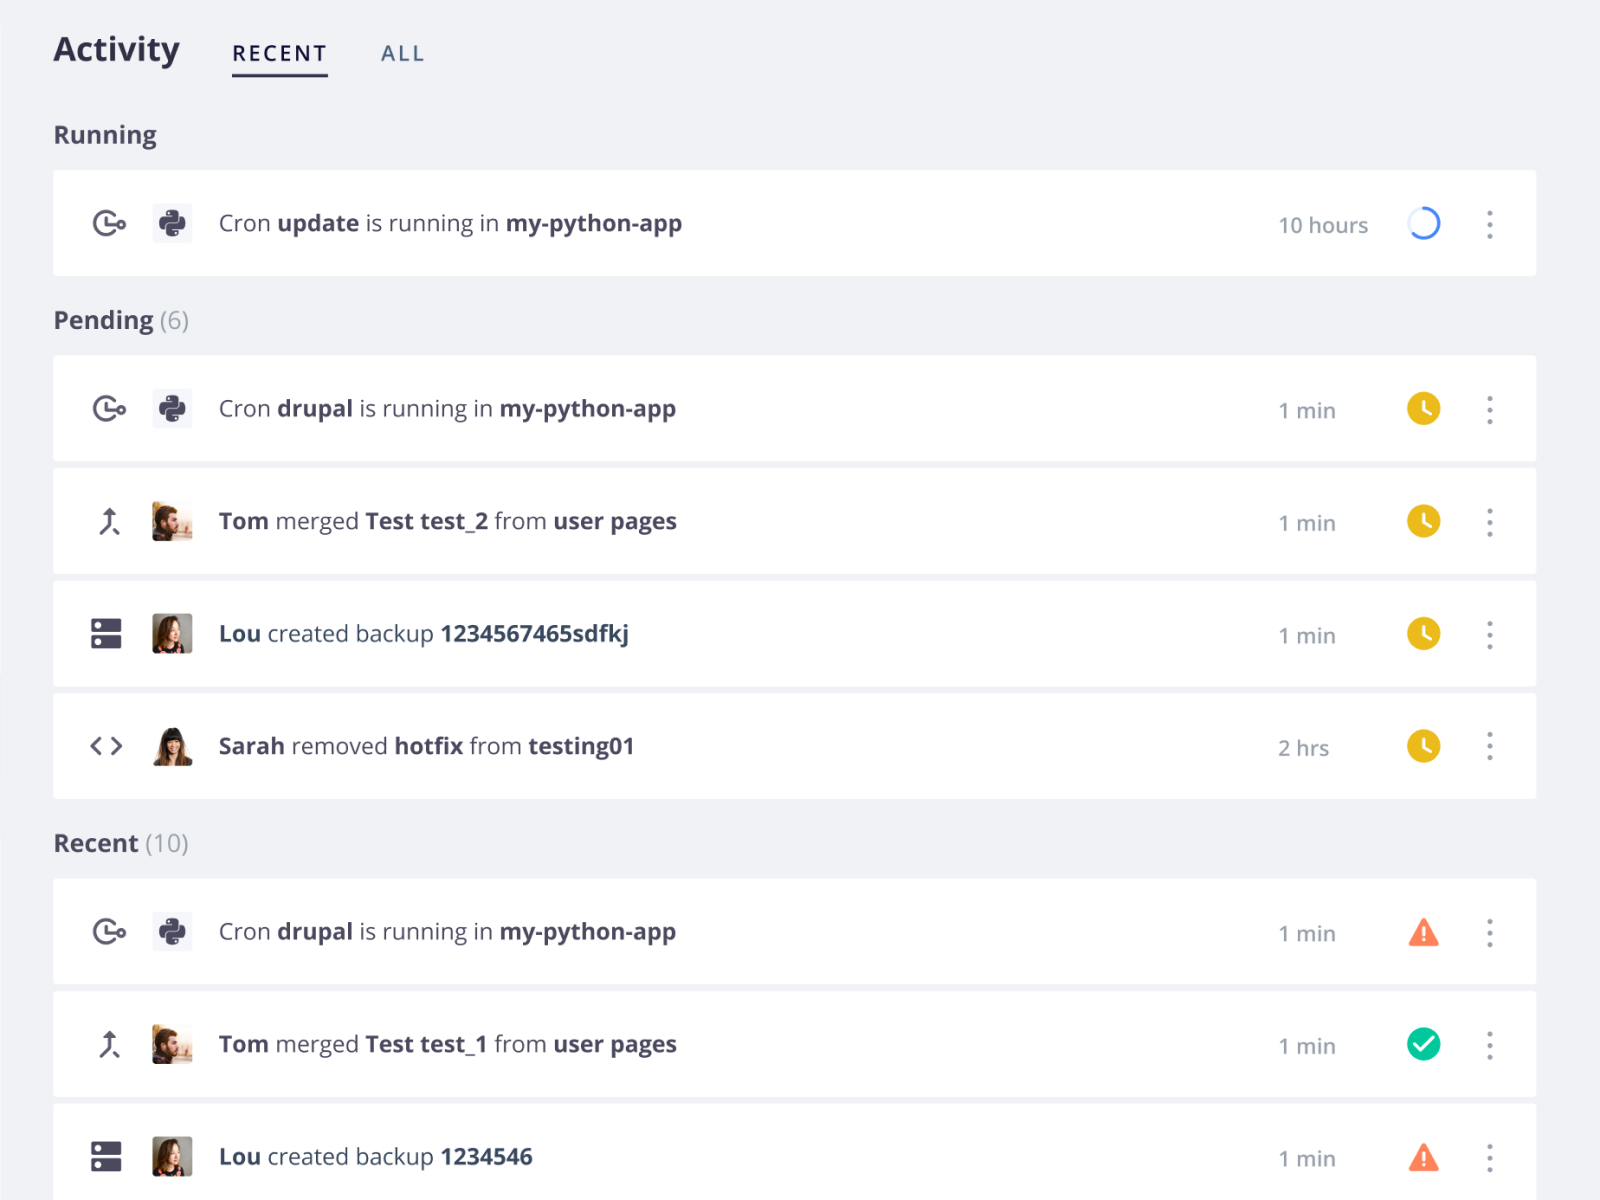
Changes to your environments, such as deployments, cron jobs, and code or variable updates,
are each logged as activities.
You can access the logs either in the Console or using the [CLI](/cli):
1. Open the project you are interested in.
2. From the **Environment** menu, select an environment.
3. Click a recent activity from the activity feed or click **All** to see the complete history.
1. Get a list of activities by running
```bash theme={null}
upsun activity:list -e
```
Pass the `--start` flag to get activities from a specific date in the past.
2. To see details about the activity's state and timing, run
```bash theme={null}
upsun activity:get
```
Where `` comes from the list in step 1.
3. Get a log of any given activity by running
```bash theme={null}
upsun activity:log
```
If a running activity is stuck, you can [cancel the activity](/docs/environments/cancel-activity).
### Sharing activity logs
When trying to identify and resolve failures, it can often help to have another person's perspective.
Troubleshoot collaboratively by sharing the logs of specific activities.
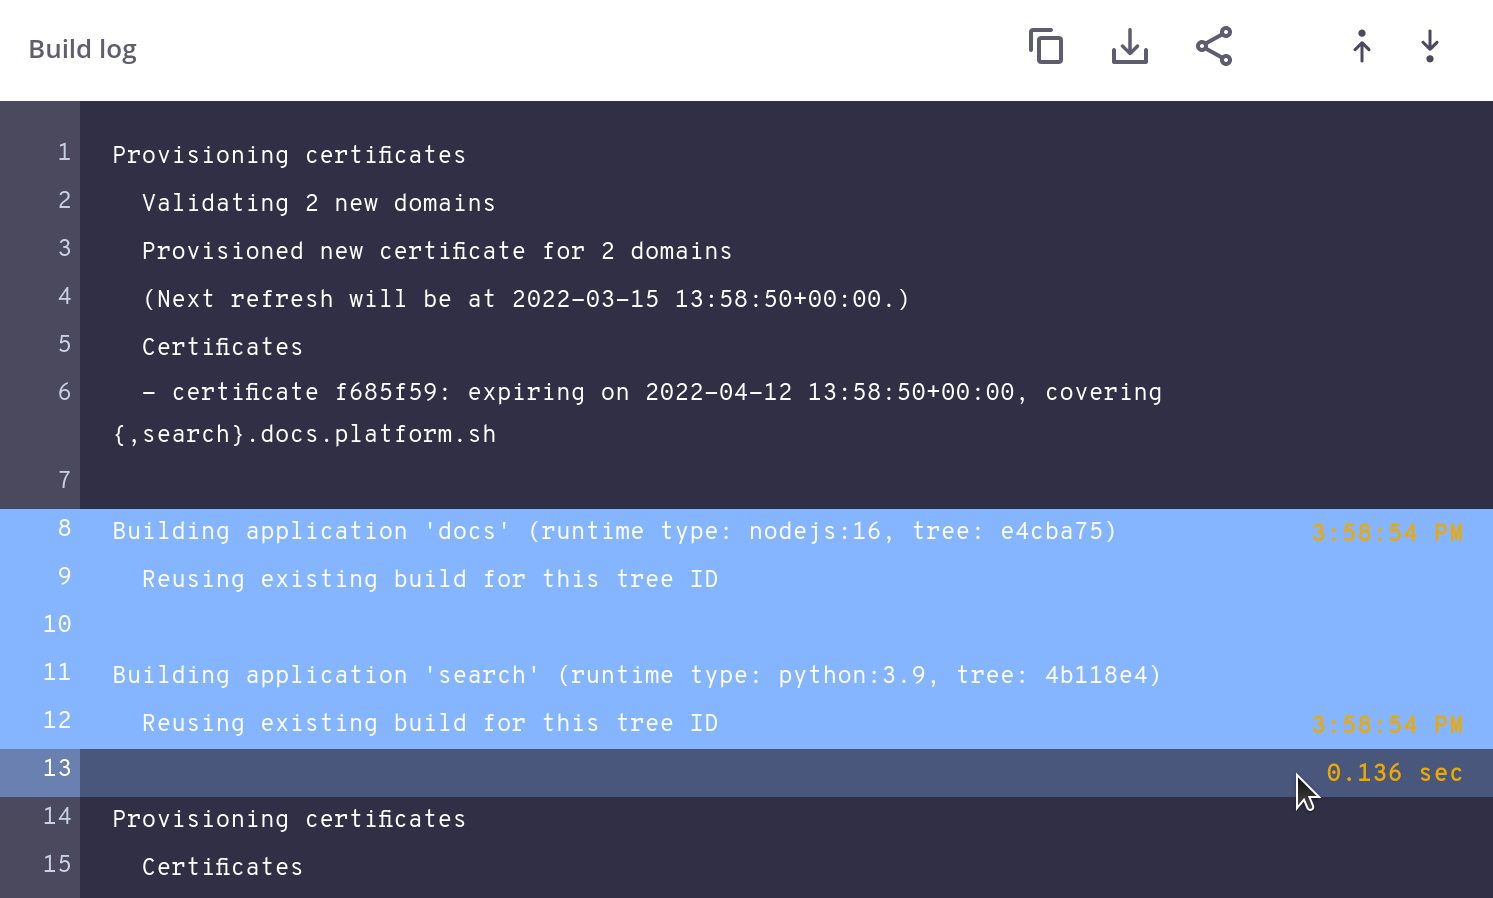
To share a log, open the log and click **Copy URL**.
Share specific lines in the log on clicking the line number.
To select multiple lines, hold Shift.
After selecting multiple lines,
hovering on the next unselected line gives you the amount of time that passed between the selected lines.
## Container logs
Events that occur within an app container are logged within that container.
The logs can be written to, but you should do so only with standard logging mechanisms.
If your app has its own logging mechanism, use it to write to a dedicated logs [mount](/docs/configure-apps/image-properties/mounts).
To access the logs of various types of events:
Use the `upsun log` command and specify the type of log you want.
For example, to get the access log, run:
```bash theme={null}
upsun log -e access
```
To get other logs, just replace `access` with the [type of log](#types-of-container-logs).
To view more lines, use the `--lines` flag.
1. Access the container by running
```bash theme={null}
upsun ssh -e
```
2. Change to the right directory by running `cd /var/log`.
If you're on a Dedicated Gen 2 cluster, run
```bash theme={null}
cd /var/log/upsun//
```
3. Read the desired log, such as by running `tail access.log`.
All log files are trimmed to 100 MB automatically.
If you need larger logs, set up a [cron job](/docs/configure-apps/image-properties/crons) to upload them to third-party storage.
See an example of [uploading logs to Amazon S3](https://gitlab.com/contextualcode/platformsh-store-logs-at-s3) from Contextual Code.
### Types of container logs
| Type | Always present | Description |
| ------------- | -------------- | ------------------------------------------------------------------------------------------------------------------------------------------------------------ |
| `access` | Yes | The raw access log for the nginx instance running on the container. It doesn't include requests that are redirected or cached by the [router](/docs/routes). |
| `app` | Yes | All log messages generated by the app including language errors and exceptions. |
| `cron` | No | The output of cron jobs. Only exists after a cron job has run. |
| `deploy` | No | The output of the [`deploy` hook](/docs/configure-apps/hooks/hooks-comparison#deploy-hook). Only exists after a `deploy` hook has run. |
| `dns` | Yes | All DNS queries made by processes in the container (such as the app and cron jobs). |
| `error` | Yes | nginx-level errors that occur once nginx has fully started such as HTTP errors for missing directories and excluded file types. |
| `nginx/error` | No | All nginx startup log messages. Only useful when debugging possible nginx configuration errors. Not currently available using the `upsun log` command. |
| `php.access` | No | A record of all requests to the PHP service. See [PHP access record format](#php-access-record-format). |
| `post-deploy` | No | The output of the [`post_deploy` hook](/docs/configure-apps/hooks/hooks-comparison#post-deploy-hook). Only exists after a `post_deploy` hook has run. |
| `syslog` | Yes | General system-wide logs. |
#### PHP access record format
The formatting of `php.access.log` is determined by the PHP settings.
To determine the format, run the following:
```bash theme={null}
upsun ssh cat -n /etc/php/-zts/fpm/php-fpm.conf | grep "access.format"
```
You get a response such as the following:
```bash theme={null}
Connection to ssh.eu.platform.sh closed.
access.format = "%{%FT%TZ}t %m %s %{mili}d ms %{kilo}M kB %C%% %{REQUEST_URI}e"
```
See what [each value in this string means](https://www.php.net/manual/en/install.fpm.configuration.php#access-format).
## Timezones
UTC is the default timezone for all logs.
 ## Container logs
Events that occur within an app container are logged within that container.
The logs can be written to, but you should do so only with standard logging mechanisms.
If your app has its own logging mechanism, use it to write to a dedicated logs [mount](/docs/configure-apps/image-properties/mounts).
To access the logs of various types of events:
## Container logs
Events that occur within an app container are logged within that container.
The logs can be written to, but you should do so only with standard logging mechanisms.
If your app has its own logging mechanism, use it to write to a dedicated logs [mount](/docs/configure-apps/image-properties/mounts).
To access the logs of various types of events: